How to stop JavaScript processing on a website with Breakpoints using Chrome developer tools

In the world of website development, JavaScript is an essential tool. This article provides a detailed explanation of how to use Chrome DevTools’ Breakpoints feature, which is helpful when problems arise in JavaScript processing. By using this feature, you can pause JavaScript execution midway to identify the cause of errors or understand why certain functions aren’t working.
This time, we’ll show you how to stop JavaScript processing on a website using Breakpoints in Chrome DevTools.
Launch Chrome DevTools
Display the website under development where you want to stop JavaScript processing in Chrome browser.
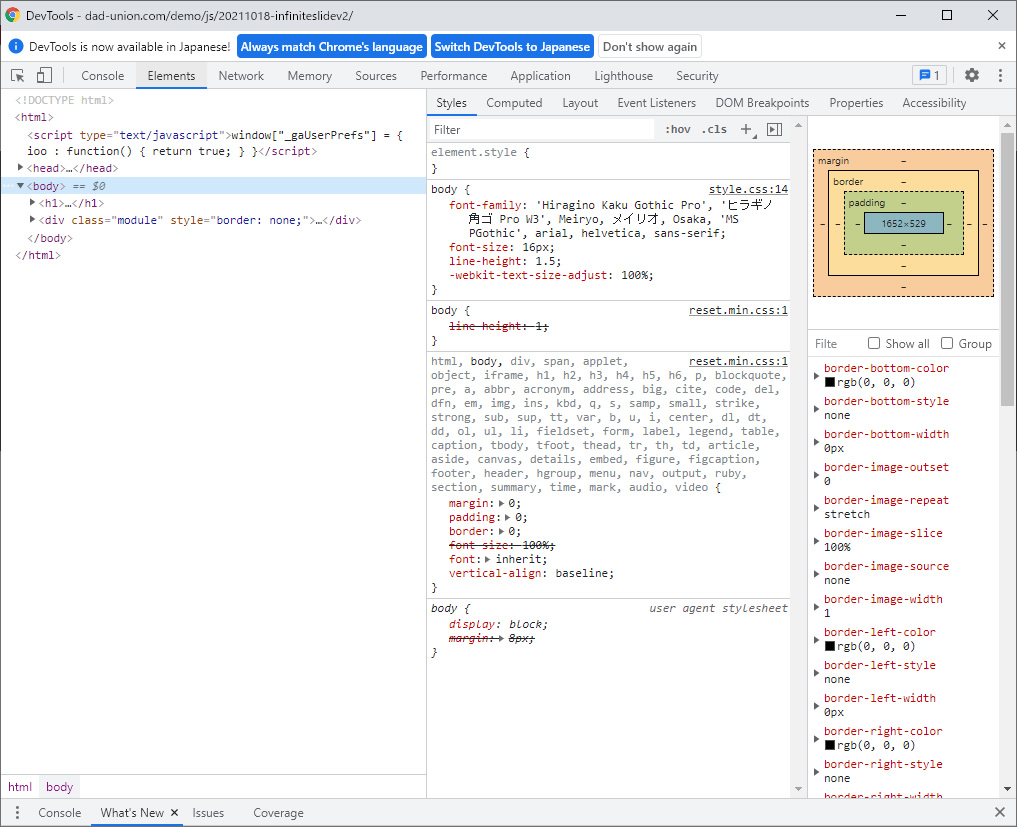
Press the “F12” key on your keyboard to launch DevTools in Chrome. (Windows environment)
(DevTools launch image)

Set JavaScript Breakpoints
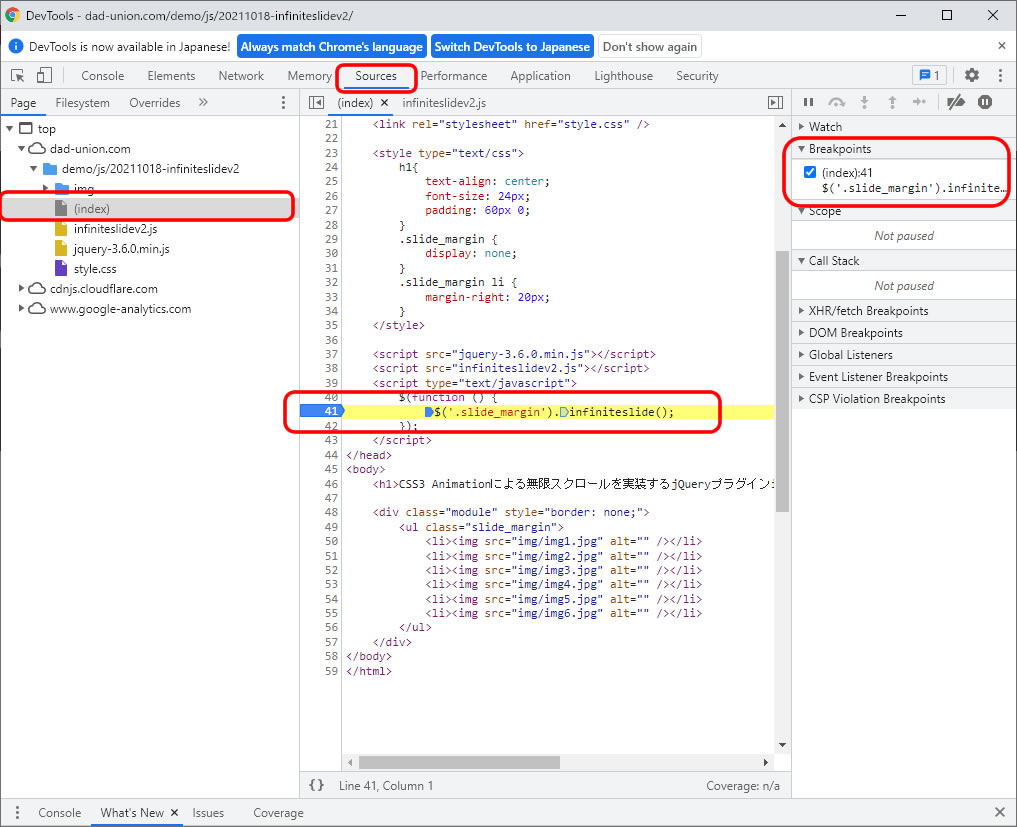
Set Breakpoints in DevTools as follows:
- Open the “Sources” tab
- From the left “Page” area, find the hierarchical page or JavaScript file
- Click the part of the JavaScript code where you want to stop execution
- In the “Breakpoints” section of DevTools, check that the breakpoint is enabled
(Breakpoint check image)

Refresh the Page (Press F5)
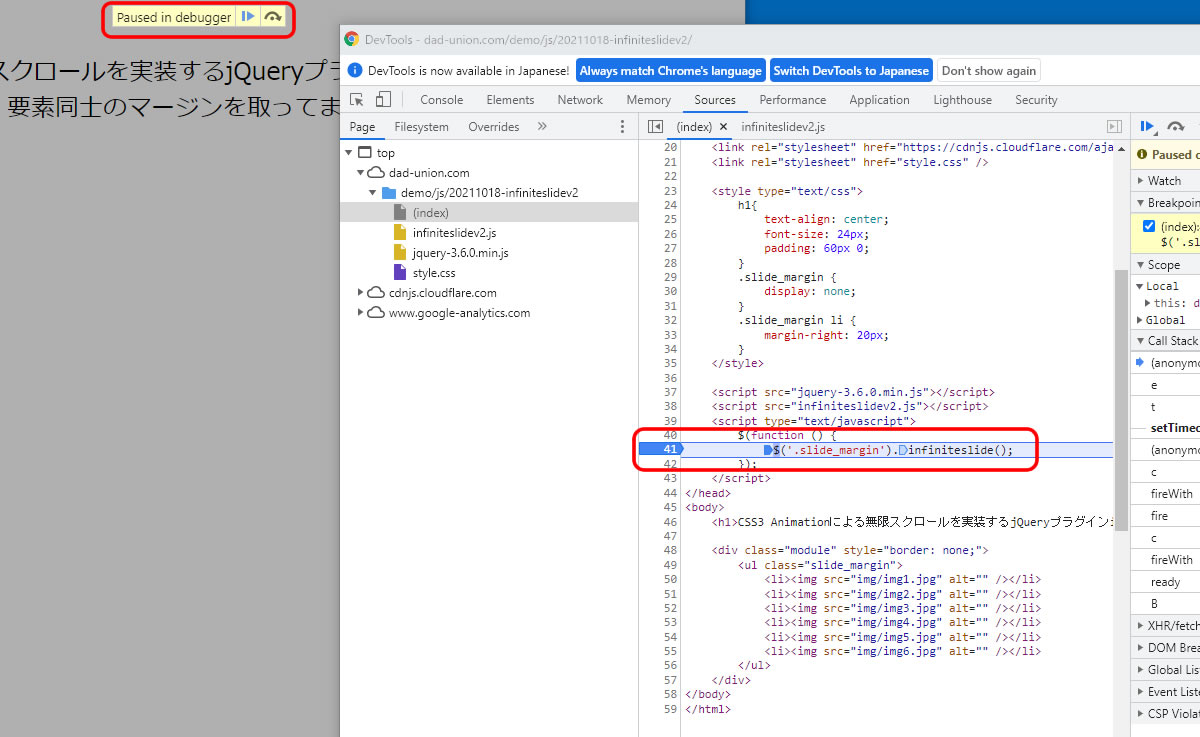
After setting the breakpoints, refresh the page (press F5) to reload it.
(Page refresh after setting breakpoints image)

The process will stop at the specified breakpoint in the JavaScript code.
A “▶” play icon will appear at the top of the page — click it to resume and continue displaying the page. Click the “arrow” icon next to the play icon to step through the JavaScript process line by line.
By setting breakpoints at suspected error points or malfunctioning code sections, you have a higher chance of identifying the root cause.
Identifying and Resolving Errors
Using breakpoints makes it easier to identify the cause of errors and locate problematic areas. You can stop at each line of code, check variable values, and follow the flow of processing.
Conclusion
The Breakpoints feature in Chrome DevTools is a powerful tool for troubleshooting JavaScript issues. Mastering this feature allows you to quickly identify and fix errors, enabling more efficient web development. By using this tool, you can reduce anxiety when errors occur and confidently work towards resolving them.
*Please use this information at your own discretion.


